The Quiet Strength of REITs in 2026

Point of View · Public Real Estate
The Quiet Strength of REITs in 2026
Throughout 2026, REITs have quietly put together one of their stronger years of relative performance. After materially lagging broader equity markets since 2020, global REITs, and in particular U.S. REITs, have begun to close that gap in 2026. As of the end of August, U.S. REITs have outperformed the S&P 500 on a year-to-date total return basis, a milestone that has drawn far less attention than it arguably deserves given how persistent the sector's underperformance has been over the past several years.
Figure 1. YTD Relative Global & U.S. REIT Performance (USD)
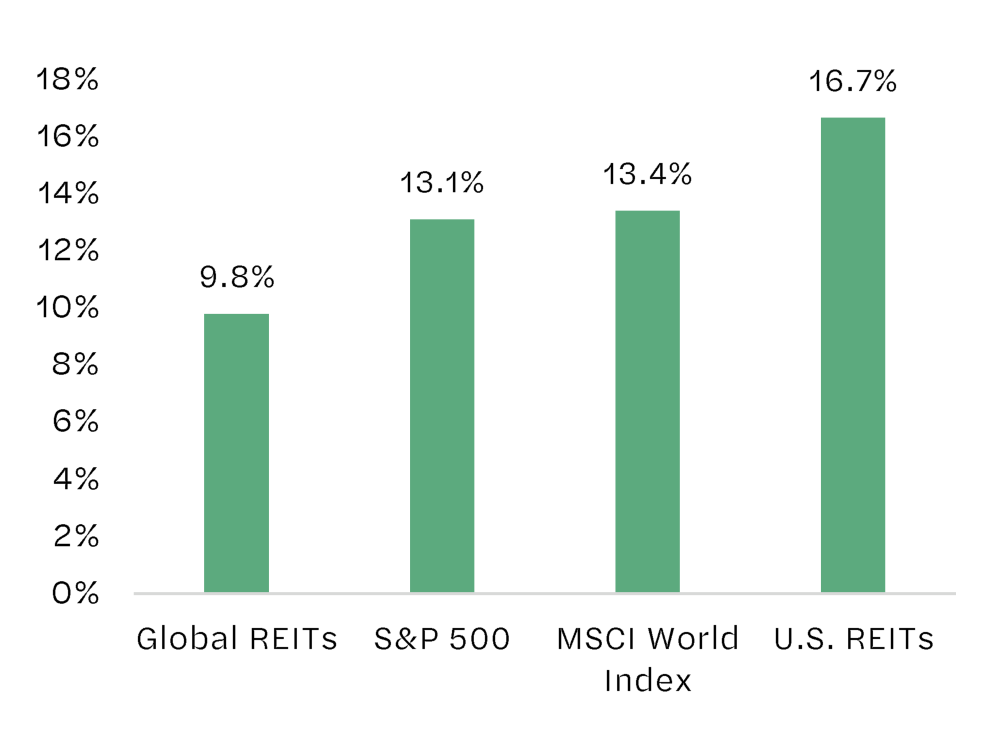
Source: Bloomberg LP. U.S. REITs represented by the FTSE EPRA NAREIT U.S. Total Return Index. Global REITs represented by the FTSE EPRA NAREIT Developed Total Return Index. Timeframe from December 31, 2025 - August 31, 2026. All returns in USD; returns to Canadian investors will differ with movements in the Canadian dollar and are unhedged unless stated.
As displayed in Figure 1, U.S. REITs returned 16.7% (USD) year-to-date through the end of August, ahead of the S&P 500's return of 13.1% (USD) and the MSCI World Index's return of 13.4% (USD), while global REITs also posted a solid return of 9.8% (USD) over the same period. The strength in U.S. REITs especially marks a meaningful shift after several years in which the sector consistently trailed the broader market. We believe this shift reflects the early stages of a transition out of an atypical period of underperformance for REITs and into a more traditional cycle, one in which fundamentals, rather than sentiment, drive returns.
Strength in the Face of Rising Yields
Perhaps the most counterintuitive element of this year's REIT performance is that it has occurred alongside a meaningful increase in bond yields. The U.S. 10-year Treasury yield rose from approximately 4.2% at the start of the year to 4.8% by the end of August, a move that would typically be expected to pressure REIT valuations given the sector's sensitivity to rising rates1.
Yet that relationship and sensitivity appear to be changing. From the start of 2022 through the end of 2024, the weekly correlation between changes in the 10-year Treasury yield and U.S. REIT returns stood at approximately -0.45, consistent with the conventional narrative that rising rates are a headwind for the asset class. However, from the start of 2025 through the end of August 2026, that correlation has dropped to approximately -0.21, a reduction of more than half as illustrated in Figure 2.
Figure 2. 10-Year Treasury Yield Changes & U.S. REIT Return Correlation
| Metric | 2022-2024 | 2025 – August 2026 |
|---|---|---|
| Correlation (R) | -0.45 | -0.21 |
| R2 | 0.20 | 0.05 |
Source: Bloomberg LP. U.S. REITs represented by the FTSE EPRA NAREIT U.S. Total Return Index. Weekly regression analysis for the periods December 31, 2021 - December 31, 2024, and December 31, 2024 - August 31, 2026.
Moreover, the R2 declined even more sharply than the correlation (R) from 0.20 to 0.05, meaning yield changes now explain less than 5% of the week-to-week variation in REIT returns, down from about 20% in the previous three years. In our view, this shift suggests that fundamentals, rather than the direction of interest rates, have become the more dominant driver of REIT performance. Despite central bank policies, including a possible shift by the U.S. Federal Reserve, moving to a more restrictive stance this year as policymakers have had to grapple with geopolitical tensions, elevated energy prices, and supply chain bottlenecks, REITs still managed to perform well in the face of these macro headwinds. While the future path of central bank policies and bond yields remains uncertain, and REIT performance could still be affected by it, we believe the asset class's performance in this environment is a good indicator that it is more resilient to different macro environments than it has been in recent years.
Fundamentals Continue to Strengthen
We believe the improvement in REIT fundamentals over the past year helps explain both the strong recent performance and the changing correlation with yields. As we outlined in our 2026 Outlook Report, new supply continues to decline across most major property types globally, while demand for space has remained resilient, gradually restoring pricing power to landlords. As visualized in Figure 3, the global new property supply pipeline is historically low and is expected to continue declining over the next 24 months, potentially hitting all-time lows.
Figure 3. Net Additions to Global All Property Supply Growth (%p.a.)
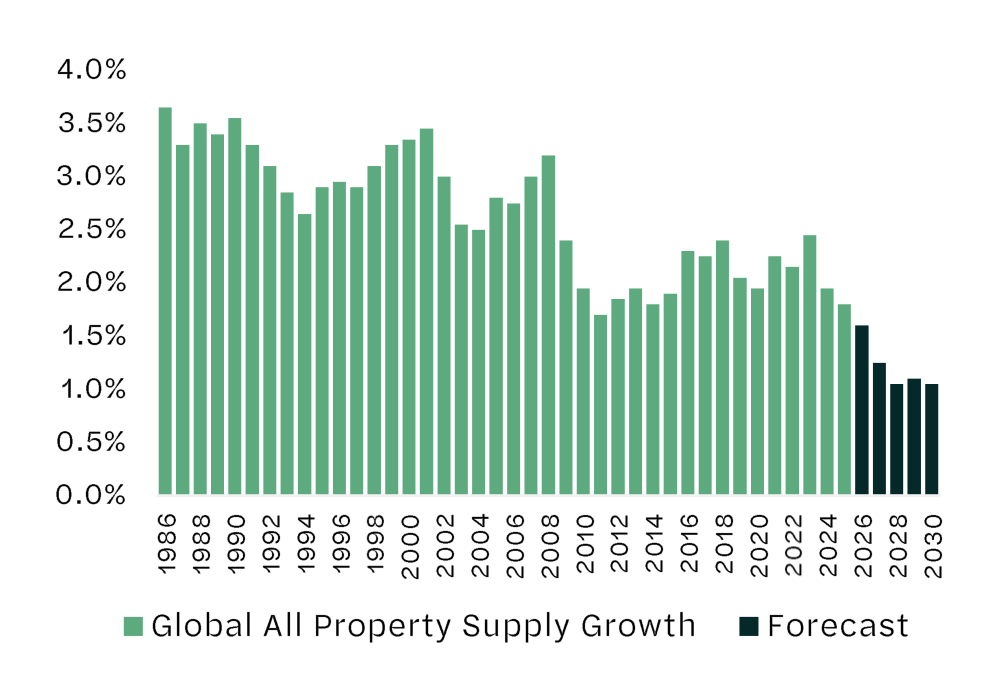
Source: CoStar, JLL, PMA, Oxford Economics, Bureau of Labor Statistics, World Bank, PGIM. As of June 2026.
This improvement in fundamentals is also visible in occupancy data. U.S. REIT occupancy across all property sectors stood at 93.8% as of the second quarter of 2026, well above the historical average and the highest level in four years2. Importantly, this strength has not been confined to a narrow set of favoured sectors. Improving sector fundamentals and performance has broadened beyond the AI-adjacent data centre trade into hotels, retail, industrial, and even office markets in gateway cities such as New York. Overall, U.S. REIT funds from operations grew materially year-over-year in the first quarter of 2026, alongside same-store net operating income growth of 3.8%, both of which point to improving operational strength3. We view this breadth as a signal that the REIT market has moved beyond a narrow recovery and into a more durable, broad-based expansion.
Valuations Remain Attractive
Despite the robust year-to-date returns, global REIT valuations remain attractive relative to global equities across several metrics. As displayed in Figure 4 and Figure 5, Price-to-Cash-Flow and EV/EBITDA multiples relative to broader global equities still screen attractively with both sitting near decade lows, while the dividend yield spread over equities remains meaningfully wider than its long-run average too4.
Figure 4. Global REITs vs. Global Equities Price to Cash Flow Ratio
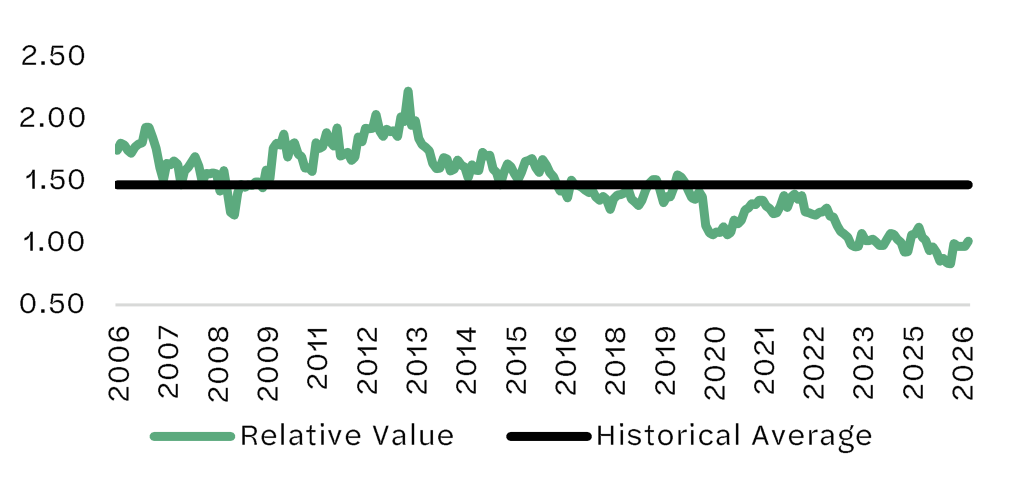
Source: UBS, Refinitiv Datastream. Data as of June 30, 2026. Real estate data is based on UBS country pricing metric database (market cap weighted average of factor model constituents). It is based on PE for all the regions except for US REITs. For US REITs it is P/FFO. And global Equities represents MSCI World index.
Figure 5. Global REITs vs. Global Equities EV/EBITDA Ratio
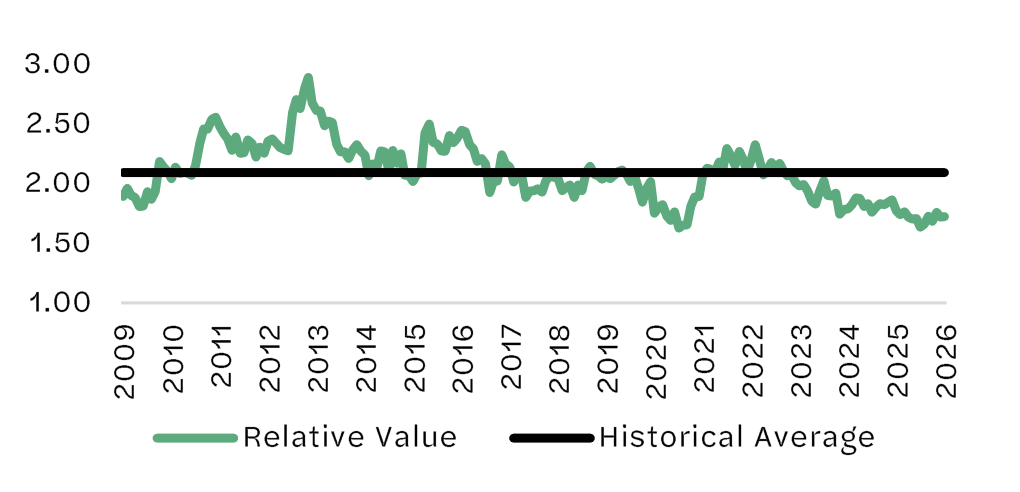
Source: UBS, Refinitiv Datastream. Data as of June 30, 2026. Real estate data is based on UBS country pricing metric database (market cap weighted average of factor model constituents). It is based on PE for all the regions except for US REITs. For US REITs it is P/FFO. And global Equities represents MSCI World index.
Management teams appear to share this conviction as U.S. REITs repurchased $3.2 billion (USD) of common stock in the first quarter of 2026 alone, more than tripling the amount from a year earlier5. That conviction is increasingly being validated by outside capital as well with eight U.S. REIT M&A transactions through June totalling $58 billion (USD), more than 80% of which represents public-to-public consolidation completed at meaningful premiums to prevailing share prices3. This activity has also been underpinned by continued access to capital, with U.S. REITs raising $35.4 billion (USD) through June 2026, including a significant share from unsecured debt issuance, an advantage that continues to differentiate public real estate from many of its private market peers3.
We also believe the valuation gap is particularly compelling today given the disruption risk facing certain segments of the broader equity market. Concerns around artificial intelligence displacing or compressing the economics of software and other service-based businesses have weighed on certain market sectors earlier this year and continue to be an overhang for select industries. Commercial real estate, by contrast, is a physical, asset-backed business that we view as comparatively insulated from this type of disruption risk, an attribute that we expect to become more valuable to investors as the debate around AI's economic impact continues.
Potential Reversion from Cyclical Lows
Perhaps the most compelling long-term argument for global REITs is where trailing returns stood entering this period of improvement. Coming into 2026, global REIT trailing 10-year returns were at or near their cyclical lows as illustrated in Figure 6.
Figure 6. Global REITs Historical Trailing 10-Year Returns (USD)
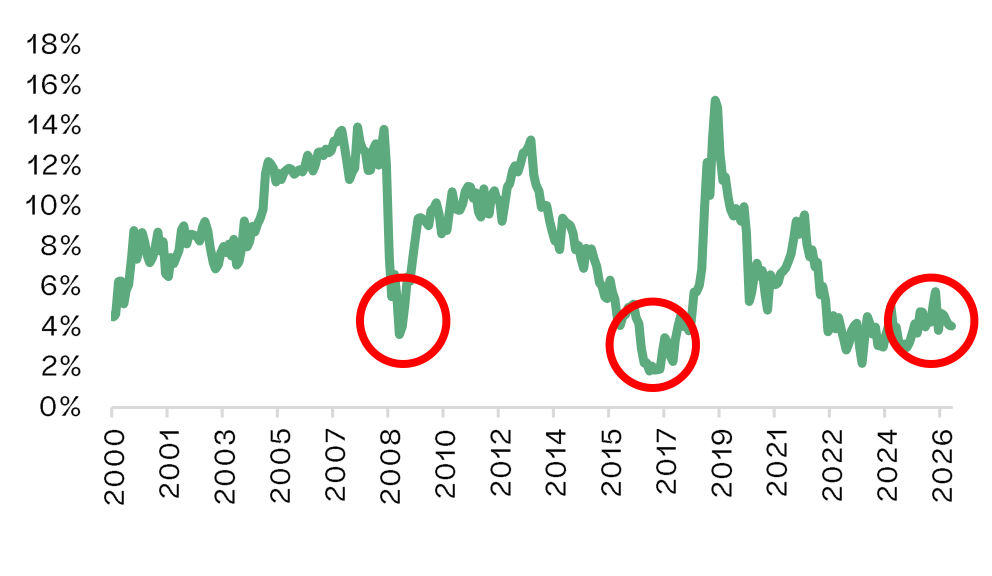
Source: Bloomberg LP. Global REITs represented by the FTSE EPRA NAREIT Developed Total Return Index. Timeframe from December 31, 1999 - August 31, 2026. Returns in USD.
We believe the confluence of tailwinds outlined here, improving fundamentals with declining new supply, resilient demand and occupancy, attractive relative valuations, and record levels of buyback and M&A activity, could support a meaningful reversion higher from these depressed levels.
Recap
REITs' strength in 2026 has, so far, been achieved quietly, without the spotlight that has accompanied other market themes. Nevertheless, the combination of competitive performance versus broader equities despite a rising rate backdrop, improving fundamentals, and still-attractive relative valuations suggests to us that this strength is more structural than transitory.
With trailing returns starting from a cyclically depressed base, we believe the setup for global REITs, and U.S. REITs in particular, remains compelling for investors.
Macro policy and geopolitical developments may continue to influence short-term index performance and valuation dispersion, but in our view, they do not alter the core relative case laid out here.
Download · PDF
Download the full whitepaper.
Sources
- Bloomberg LP. Data as of August 31, 2026.
- NAREIT T-Tracker. Data as of June 30, 2026.
- NAREIT 2026 Mid-Year Update, July 7, 2026.
- UBS, Refinitiv Datastream. Data as of June 30, 2026.
- S&P Global Market Intelligence. Data as of March 31, 2026.
Disclaimer
Certain statements in this document about Hazelview Securities Inc. ("Hazelview") and its business operations and strategy, and financial performance and condition may constitute forward-looking information, future oriented financial information, or financial outlooks (collectively, "Forward Looking Information"). The Forward-Looking Information is stated as of the date of this document and is based on estimates and assumptions made by Hazelview in light of its experience and perception of historical trends, current conditions and expected future developments, as well as other factors that Hazelview believes are appropriate and reasonable in the circumstances. There can be no assurance that such Forward Looking Information will prove to be accurate, as actual results, yields, levels of activity, performance or achievements or future events or developments could differ materially from those expressed or implied by the Forward-Looking Information. Any index, sector, or market data referenced herein is provided for illustrative purposes only and does not reflect the performance of any Hazelview fund, strategy, or client account. This document is for informational purposes only and is not an offer or solicitation to deal in securities. Any opinion or estimate contained in this document is made on a general basis and is not to be relied upon for the purpose of making investment decisions. The statements made herein may contain forecasts, projections or other Forward-Looking information regarding the likelihood of future events or outcomes in relation to financial markets or securities. These statements are only predictions. Actual events or results may differ materially, as past or projected performance is not indicative of future results. Readers must make their own assessment of the relevance, accuracy and adequacy of the information contained in this document and such independent investigations as they consider necessary or appropriate for the purpose of such assessment. This document does not constitute investment research. Consequently, this document has not been prepared in line with the requirements of any jurisdiction in relation to the independence of investment research or any prohibition on dealing ahead of the dissemination of investment research.
Any research or analysis used in the preparation of this document has been procured by Hazelview for its own use. The information is not guaranteed as to its accuracy. The information provided is general in nature and may not be relied upon nor considered to be tax, legal, accounting or professional advice. Readers should consult with their own accountants, lawyers and/or other professionals for advice on their specific circumstances before taking any action. The information contained herein is from sources believed to be reliable, but accuracy cannot be guaranteed. Hazelview Securities Inc. is currently registered with the Ontario Securities Commission as a portfolio manager, investment fund manager, and exempt market dealer. Hazelview Securities Inc. is a wholly-owned subsidiary of Hazelview Investments Inc. The returns shown throughout this document are index returns. An index cannot be invested in directly, index returns do not reflect the fees, expenses, commissions or taxes an investor would pay, and they are not the returns of any fund, strategy or client account managed by Hazelview Securities Inc. All returns are stated in U.S. dollars. A Canadian investor holding an unhedged position would have realized a different return over the same periods depending on movements in the Canadian dollar. Listed real estate carries risks that the trends described here do not remove. REITs use leverage, which magnifies equity returns in both directions and leaves them dependent on continued access to debt markets at acceptable terms as borrowings mature. Share prices are set in public markets and can fall sharply and quickly regardless of the value or operating performance of the underlying properties. Returns are concentrated by property type, tenant and geography, and a sector that has led can lag. The reduced sensitivity to bond yields described above is measured over a twenty-month period. It may not persist, and a return to the historical relationship would make rising yields a headwind again. Prior recoveries from cyclical lows do not indicate that a similar recovery will occur, and the forward-looking statements in this document are subject to the qualifications set out in this disclaimer.
Looking for another way to connect?
Follow us for insights, updates, and a closer look at how we create long-term value across real estate investment.
- CTA Text Field: Add a content block and wrap it in a hyperlink.
- Do not add any custom classes.
- You may use bold formatting for emphasis.
-
CTA Icon (Optional): Upload an image in either of the following formats:
- .PNG Sprite
- .SVG file

- CTA Text Field: Add a content block and wrap it in a hyperlink.
- Do not add any custom classes.
- You may use bold formatting for emphasis.
-
CTA Icon (Optional): Upload an image in either of the following formats:
- .PNG Sprite
- .SVG file
